
Oh! This entry is more than 2 years old.
I've decided to let some of my old work stay on this site as a reference point to my progress!
The Road to Norway
The assignment
A stress assignment, we had one week to make an infographic, displaying a lot of information without using traditional charts and graphs. We could choose our own topic. There are 45,2 million refugees in the world today, I chose to display the journey that many of these refugees have to take to get a better life.
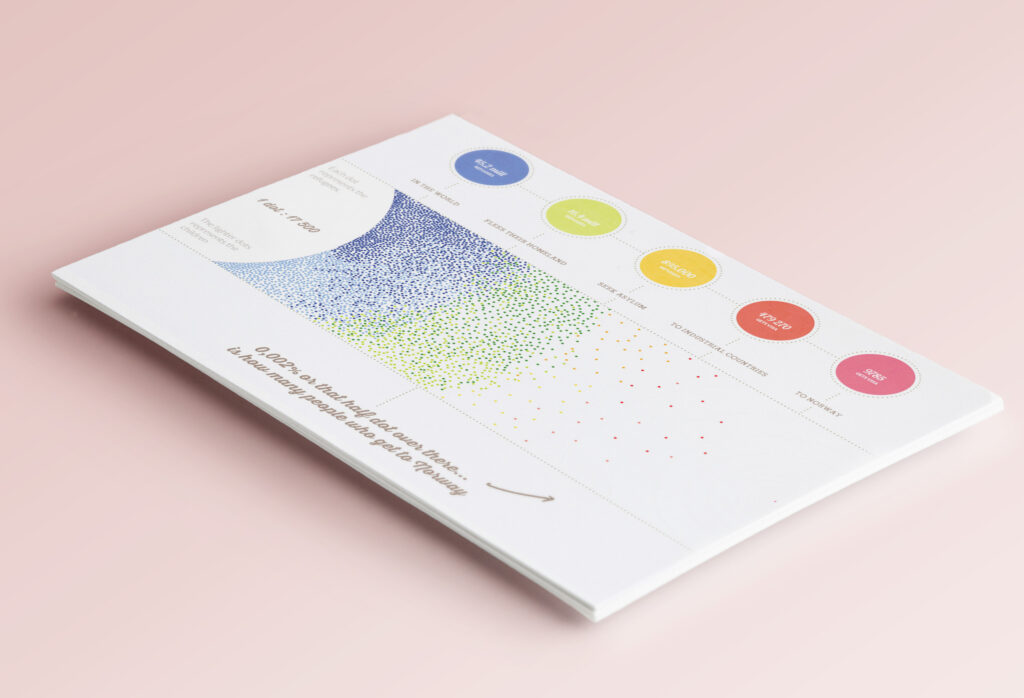
The infographic
Each dot represents 17 500 refugees. The light dots are children (ca. 50%) and the dark dots are adults. The colors represent where they are in the journey. Only 9785 people of 45,2mill (or 0,002%) make it to Norway.
The Process
Making an infographic that represents the lives of 45,2 million people is no piece of cake. Coming up with the concept was a challenge for me, I tried many different versions on how to display the stream of people. The main idea I had was that I wanted kind of a bird perspective, and that I wanted the infographics to really make an impact before you saw the statistics.
Accuracy
I wanted the infographics to be 100% accurate, therefore I did the math and made the exact number of dots and moved them manually in place. Needless to say it took many hours to complete, but it was worth it. It was also important to me to show how many children was in this massive crowd, I ended up making the lighter dots represent the children